Resources to help determine climate outlook
Date: 03 Mar 2020
Key Points
- Resources are available to help growers interpret rainfall and weather forecasts
- ‘Chance of any rain’ and ‘possible rainfall’ values need to be considered separately in rainfall forecasts
- Rainfall outlook and root zone soil moisture maps provide data for any farm across Australia
- Regional climate guides are available to help growers better understand their local climate
- Improving the accuracy of short-range and medium-range weather forecasting a focus for GRDC.
Resources to help determine climate outlook
The subject of weather forecasting is often a contentious one among growers.
While this is something which will always be debated, a number of resources are available to help growers interpret weather forecasts and plan accordingly for the conditions on the horizon.
Bureau of Meteorology Media and Communications Manager Neil Bennett also provides advice, in a GRDC podcast, on how to understand weather forecasts and rain deciles.
-
GRDC PodcastPodcast
GRDC Podcast: Interpreting Weather Forecasts
At a meeting of the Esperance Port Zone, Regional Cropping Solutions Network, mid way through 2019, a decision was made to help grain growers better understand weather forecasts and rain deciles.
Date: 12 Feb 2020


Interpreting BoM daily rainfall forecasts
The Bureau of Meteorology (BoM) is Australia's national weather, climate and water agency.
BoM publishes daily rainfall forecasts nationally which are split into two parts; ‘possible rainfall’ and ‘chance of any rain’.
A blog post from BoM relating to this subject breaks down these elements and explains their meaning.
The ‘chance of any rain’ value refers to the likelihood of a particular location receiving more than 0.2 millimetres of rainfall (the minimum measurable amount) over 24 hours from midnight to midnight.
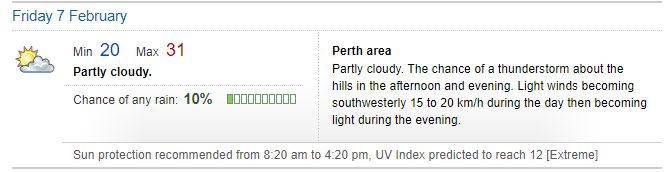
‘Possible rainfall’ is presented as a range between two values, such as 4 to 15mm. The first value means the location has a 50 per cent chance of receiving at least that amount of rain. The second represents a 25 per cent chance of receiving at least that amount.
For example, if Perth had a forecast of 4 to 15mm of rain and a 70 per cent chance of any rain, this means there is a 70 per cent chance over 0.2mm of rain will fall, a 50 per cent chance of receiving at least 4mm and a 25 per cent chance of receiving at least 15mm.
Rainfall outlook maps
BoM also has a number of digital resources which can help growers with long-term forecasts, which may be useful for pre-sowing planning.
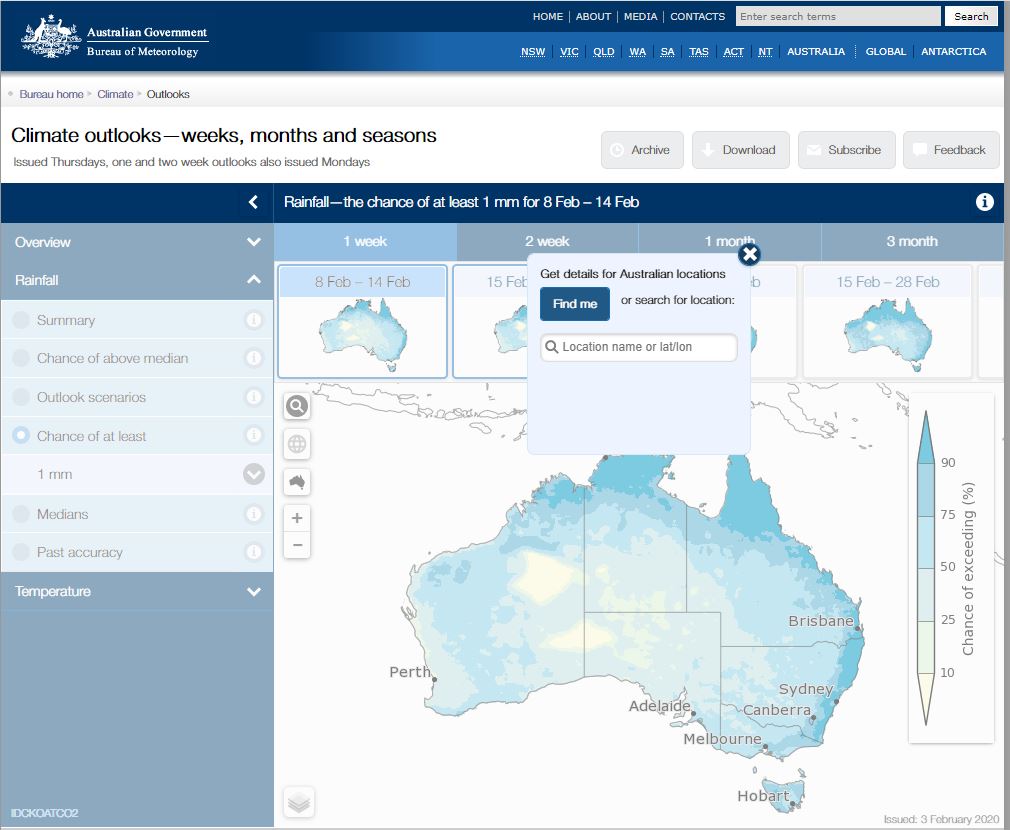
One of these resources is the rainfall outlook maps.
These maps detail the chance of above median rain by location, outlook scenarios by location and ‘chance of at least’ rainfall by location.
The ‘chance of at least’ rainfall outlook map is a particularly useful tool for growers, as it enables the user to search their location and determine the likelihood of a minimum amount of rainfall of their choosing up to three months out.
These outlooks are also supported by past accuracy readings, which informs how accurate the outlook has been at that time of year for that location. This enables the user to make their own judgement as to how likely the outlook is to eventuate.
Root zone soil moisture maps
This map gives an overview of observed soil moisture at multiple depths, and evapotranspiration rates for any location in Australia.
While a grower’s own in-situ soil moisture probe would give a more accurate reading at a local level, the information from BoM’s root zone soil moisture maps could be useful in making grain marketing decisions, particularly if other grain growing areas of the country have low soil moisture.
The data on these maps is able to be viewed in values relative to historical patterns so the user can determine whether soil moisture levels are above average or highest, through to below average or lowest.
Climate resources
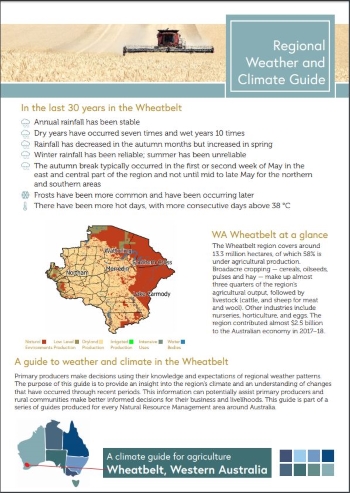
Regional climate guides have been created for each of the 56 Natural Resource Management regions across Australia as part of the Federal Government’s Drought Assistance Package.
These guides, available on the Climate Kelpie website, National Farmers’ Federation FarmHub, or BoM website, provide growers and regional communities with facts about the likelihood, severity and duration of key weather variables that affect the resilience of their businesses and communities.
The guides aim to help primary producers better understand their local climate as it relates to key decisions, and plan suitable risk mitigation strategies.
Creation of the guides has been a collaboration between the BoM, the CSIRO and FarmLink Research.
A number of decision support tools are also available on the Climate Kelpie website to help producers make climate-related decisions.
GRDC focus
Improving the accuracy of short-range and medium-range weather forecasting is one of the Key Investment Targets in GRDC’s Research, Development and Extension Plan 2018-23.
There are three key components to the KIT investment strategy in weather forecasting:
- Growers have an improved understanding of weather forecasts
- Growers have access to the tools and knowledge required to extract the maximum value from current weather forecasts
Growers have access to accurate forecasts at the farm and/or paddock scale out to 14 days
More Information
Was this page helpful?
YOUR FEEDBACK